Explore how the new TICC-DASH dashboard makes managing Chrony NTP clients straightforward and lightweight.
If you’ve ever worked with Chrony for network time synchronization, you probably know that managing it through the command line can sometimes be a bit of a hassle. That’s where the new Chrony dashboard, TICC-DASH, steps in to make life easier — especially if you prefer a simple, web-based interface to keep an eye on things.
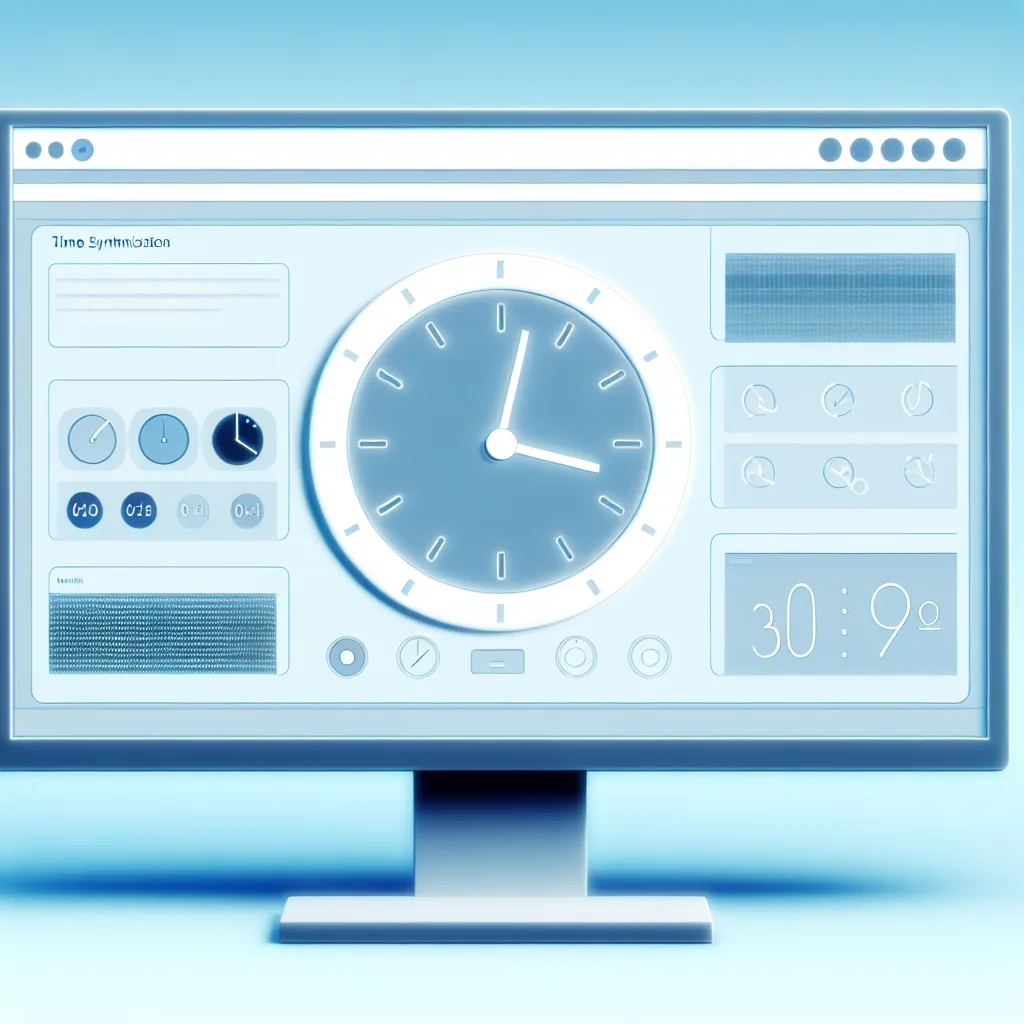
The “chrony dashboard” is designed as a lightweight and user-friendly tool for monitoring Chrony clients. It was formerly known as Chrony NTP Web Interface V2 but has now been revamped under the name TICC-DASH. The dashboard gives you a clear view into your time synchronization setup without weighing down your system.
What Makes TICC-DASH Stand Out as a Chrony Dashboard?
One of the key features of this new chrony dashboard is its simplicity. Unlike some heavier monitoring tools, TICC-DASH focuses on doing one thing well — providing a real-time display of Chrony NTP client statuses and statistics. It doesn’t require extensive setup or resources, which makes it an excellent fit for lightweight server environments or even home labs.
Easy to Use and Access
TICC-DASH offers a clean and intuitive web interface. You don’t have to fuss around with cryptic command-line outputs anymore. Instead, you just open your browser, hit the dashboard URL, and instantly see your synchronized devices and their status. It shows sync sources, offset, delay, and other key metrics that are essential for troubleshooting or just general monitoring.
The dashboard also supports multiple clients, so if you run several devices with Chrony, you can manage and monitor them all in one place.
Installing and Getting Started
Installation is straightforward and well-documented. You can find the official resources and instructions on the project’s GitHub page or the developer’s documentation site. Since it’s lightweight, you won’t have to worry about heavy dependencies or complex configurations.
For those who want a reliable NTP monitoring tool that just works without the clutter, TICC-DASH could be the perfect fit. It’s especially handy for sysadmins, hobbyists, and anyone who’s passionate about keeping their servers or networks perfectly synchronized.
Why Use a Chrony Dashboard?
If you’re new to using a Chrony dashboard, you might wonder why you need one at all. The main benefit is visibility. Time synchronization is critical in many areas — from logging and security to distributed systems and network management. Having a dashboard gives you an easy way to spot issues early before they cascade into bigger problems.
For more in-depth info on Chrony itself, Chrony’s official documentation is a great place to start. And if you want to dive into time synchronization in Linux more generally, Red Hat’s guide to NTP has solid background and practical tips.
Final Thoughts on TICC-DASH
While the world of NTP and Chrony might seem niche, tools like TICC-DASH help bring a bit of user-friendliness to the fray. It’s refreshing to find an open-source project that keeps things simple without compromising on usefulness. If you’re running Chrony clients and want a straightforward, no-fuss way to monitor them, definitely check out TICC-DASH.
And if you’re curious about how to set it up or want to see it in action, the project’s main site and repository will have the latest updates and downloads.
In short, TICC-DASH is a handy chrony dashboard that’s worth a look if you want to keep time sync management neat and tidy, with minimum fuss and fussiness. Sometimes, the best tools are the ones that just do what they’re supposed to, without extra noise.